When you first discover the FIRE concept, there is a lot of info that is coming your way. It might be overwhelming to come up with a budget yourself, let alone a 30+ years FIRE plan. Take look behind the curtains and see what we do!
The goal of the tool is to give you a back of the envelop view of your expected FIRE date, based on where you are know and what you think might happen.
The tool is on Google Drive. Make a copy to play yourself
Sounds scary?
It is. Some tools and rule of thumbs can make it digestible. As a result, you get a graph with an indication of the year of FIRE. WARNING: you might not like the result. In that case, use it as a motivation to review your spending and income.
The input is limited.
Your current assets marked for FIRE. In my case, I exclude money marked for future holidays and the emergency fund. That is my choice.
Your current spending. The tools adjusts for inflation.
What you can add to your investments each year. Knowing your budget is a must if one day you want to FIRe.
Your ideal Safe Withdrawl Rate. There is a lot of debate. To you take 4%, or 3,5% or something else. The choice is yours
A range of expected returns. So, you get an idea of the best and worst case scenario.
How to use the tool?
In general, only touch the green fields, leave the rest alone. Best is to take a copy of the spreadsheet and save it in your own drive.
First, go to the tab with the investments.
Here, you can enter per year the amount of money you foresee to invest. There are some suggested categories for your inspiration. You are not obliged to use the all. In you specific situation, some categories might not be available: enter the amount in another category. What matters is the final sum: total invest.

Then, go to the tab When FIRE.
Complete some assumptions and the details on your expenses and mortgage.
 market return 1, 2 and 3 are your expected returns of the market. You can use this to have some idea of a worst case, normal case and best case. There is no crystal ball included in the tool.
SWR: what Safe Withdrawl Rate do you want to have? The Trinity study suggest 4%, some bloggers go to 3,5%, others take 3,28%.
Monthly expenses: enter your monthly expenses, including holiday (year budget/12) but exclude the mortgage
There are also 2 fields for the mortgage: the monthly payment and the year that your mortgage ends. These data are used in the tool.
Inflation: what inflation do you expect to be the average over the next decades. A tough one. Nobody said it is easy to make a FIRE plan. One way to look at it is to take the last decades average, or to take the target inflation the ECB targets.
Getting to the 2 lasts steps
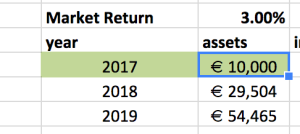
Enter your start postion. I my personal calculation, I excluded the emergency fund and the travel fund.
 And as a last step, enter the planned expenses you have. These are elements you think should not come out of your emergency fund.
Time to look at the results!
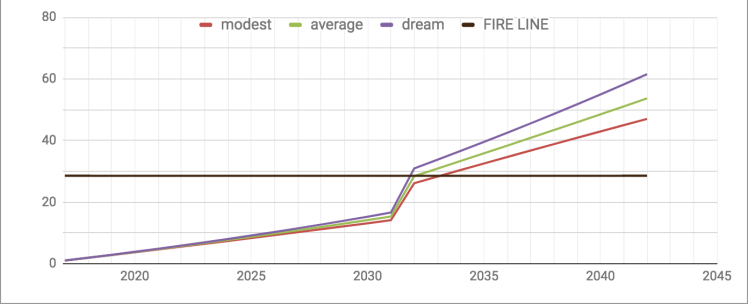
The tool generates a graph that shows you for each scenario the evolution of your nest egg. When the line crosses the black horizontal line, you are FI according to the SWR definition
What do you think of the tool? Do you have a tool you want to share?

Hey AT, I actually looked at the tool over the weekend. Nice work, could not look at it long enough to find any errors though 😉 Another great service/tool for the FIRE community!
LikeLike
I also looked at it this weekend (work and life have been keeping me busy). Pretty good tool. Flexibel enough for every persons individual situation but not too complex. With my renovation costs still to come it gave me 5 years of work. Without the renovation costs 2 to 3 years … Perhaps I do need to talk to my parents …
LikeLiked by 1 person
Thx…
That talk with your parents sounds worth it.
LikeLike
Thanks for this, really useful. I didn’t like the results, but you did warn us!
LikeLike
Great spreadsheet to play with. Very nice that you incorporated multiple market returns in the responsive graph.
I will certainly check it out some more in the future. In the short time I looked at it I found out that the graph only shows the results till 2042. The list ends at 2047. Easy to fix.
Thanks for sharing!
LikeLike
Great tool AT! Once I stabilize my “new” business income, I will certainly use it!
LikeLike
This is a really cool spreadsheet. I played with it for a while tonight. I added in dividend reinvestment and options income reinvestment as well. I’m going to make a few tweaks and I’ll let you know hoe it works for me. Thanks for creating this and for sharing it.
LikeLike
A ver useful tool. Thanks for sharing!
LikeLike